jemalloc with Ruby and Docker
Ruby is an incredibly powerful and convenient language that does a lot for developers behind the scenes. One of the most important things it does is create and garbage collect objects automatically. To make sure our programs don't run out of memory though, Ruby needs an efficient way to allocate and release memory.
When the Ruby executable is built, it's designed to use the C standard library functions malloc() and free() to allocate memory and release memory, respectively. In most cases, there's a standard library, such as GNU libc, that provides an implementation for these functions. These standard implementations are really flexible and provide good performance for most workloads, but for scripting languages like Ruby, there's room for improvement!
Ruby, we've got a problem
Binti is primary implemented as a Ruby on Rails application, deployed via Kubernetes (sometimes abbreviated as K8s). For this article, you don't need to know too much about Kubernetes other than the fact that it lets us specify the maximum amount of memory each Rails server is allowed to get. If the server exceeds that limit, Kubernetes terminates the process and restarts it. (Technically Kubernetes terminates the pod, but that causes the process to terminate as well, so we say "Kubernetes terminates the process" as a shorthand in this article.)
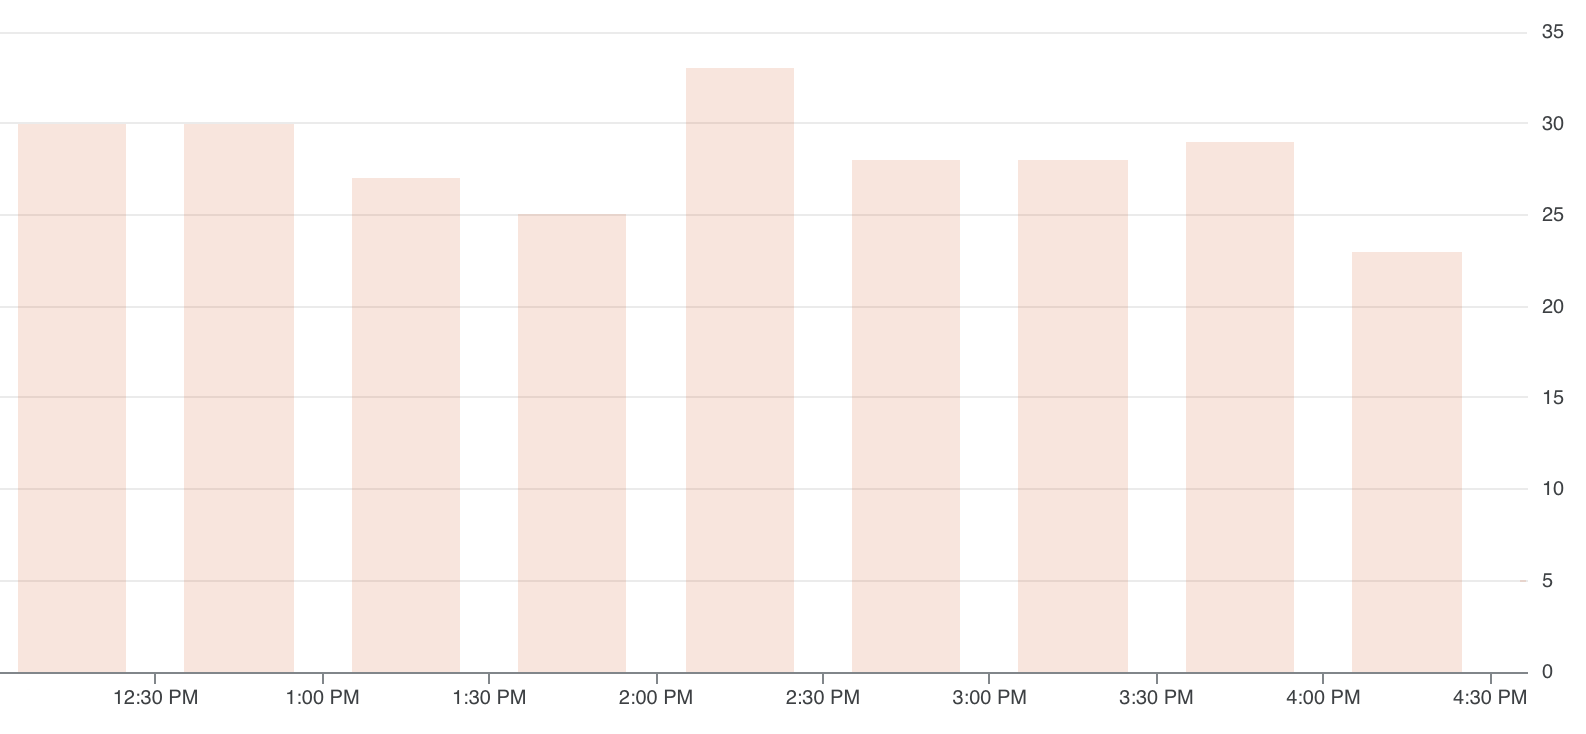
In our case, we had allowed our servers up to 3GB of memory and discovered that Kubernetes was terminating the processes because they were hitting that limit. In fact, Kubernetes was terminating about one process per minute! Given the size of our deployment, that was a lot.
Can we reach a stable point?
The first thing we tried to address this problem was simply to increase the memory we allowed our Rails process to use. Our hypothesis with this approach was that Rails might have a stable point of memory usage that just happened to be higher than the 3GB we had allocated. If we just adjusted our memory allocation above that point, we hoped that would allow Rails to reach that stable point of memory usage and the terminations would stop.
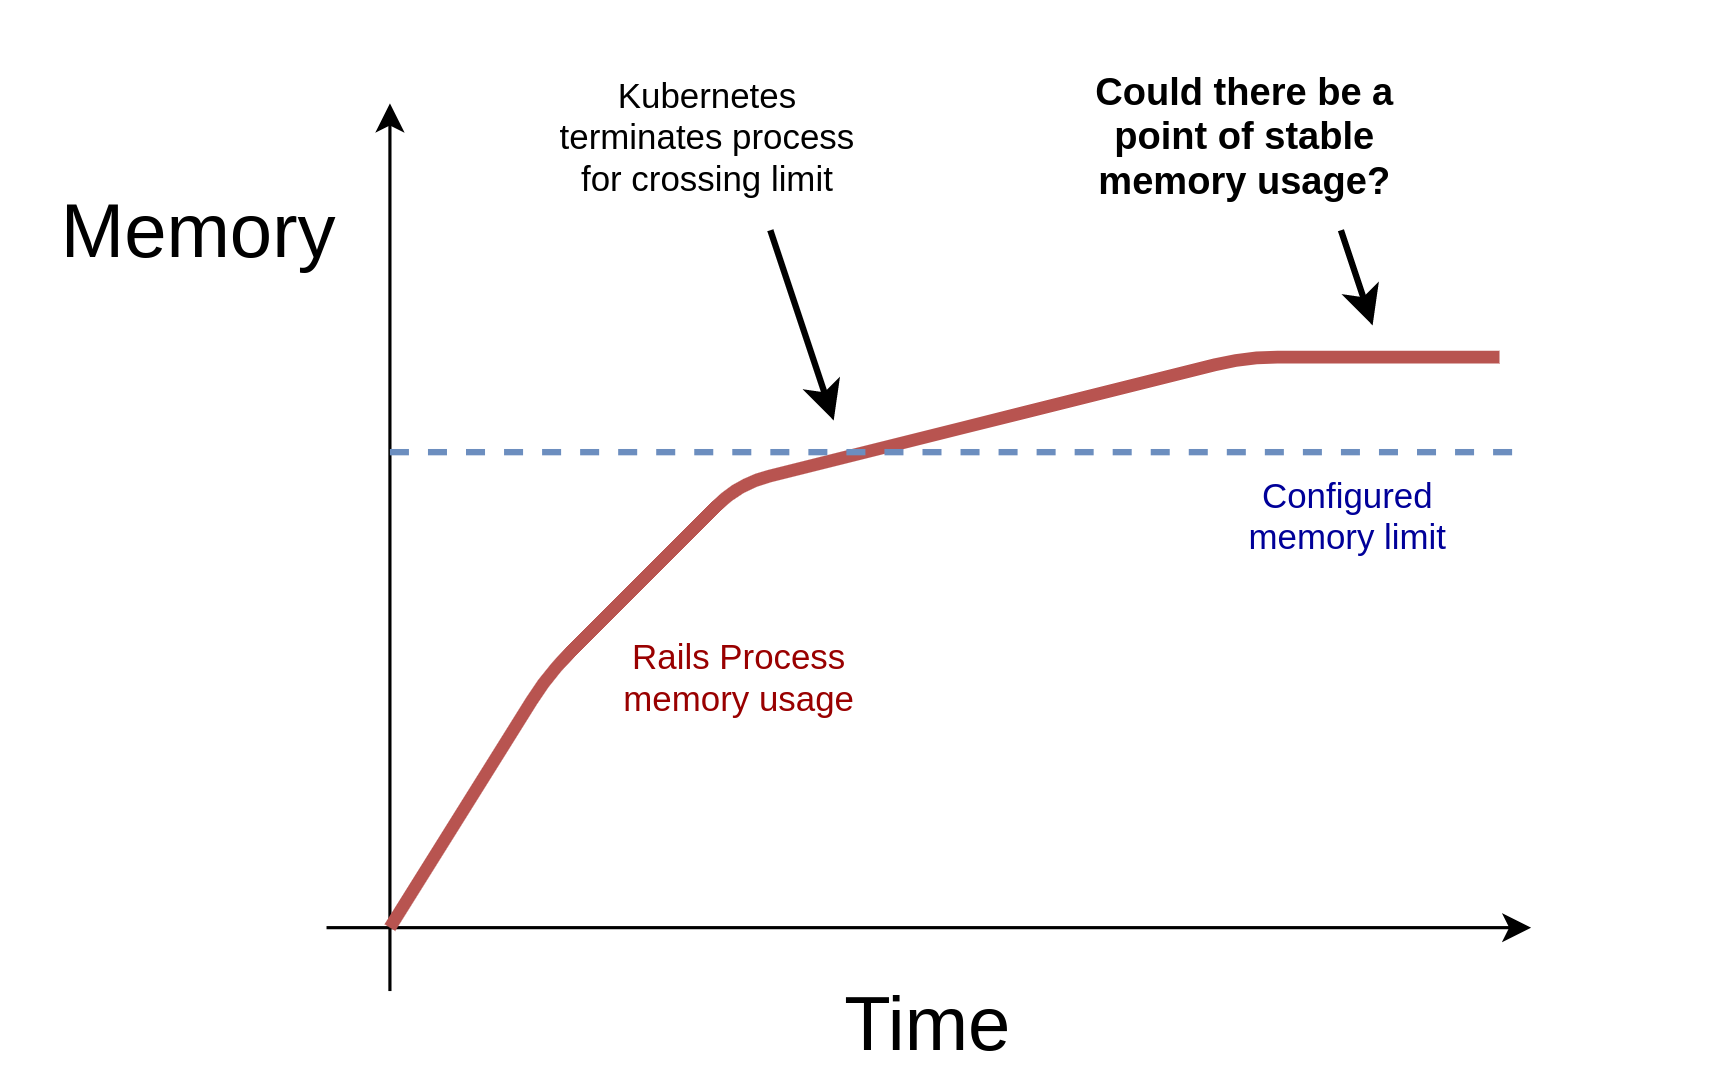
Unfortunately when we tried increasing the allowable memory limit, Rails never reached a stable point even up to 4GB and we started looking for another approach...
A better malloc()?
As mentioned above, the standard libc implementation of malloc() works well for most programs, but after doing some research, we found that another implementation called jemalloc often worked better for dynamic languages like Ruby.
jemalloc is designed as a "drop-in" replacement for malloc() because it conforms to the same interface and contract as malloc(), so we thought we'd give it a try.
It turns out that it's incredibly easy just to get Ruby to use jemalloc just by setting the environment variable LD_PRELOAD=<path to libjemalloc.so>
We first started by monitoring memory usage in our development Rails server using a script adapted from this gist to measure the memory usage of the Rails process over time. Then we used a long, 10-15 minute browser-driven test (implemented in Cypress) to induce load on our test server.
First we tested using GNU libc (also known as glibc) and found that memory usage increased steadily over the lifetime of the test without stopping, taking up 2.5GB by the end of the test...
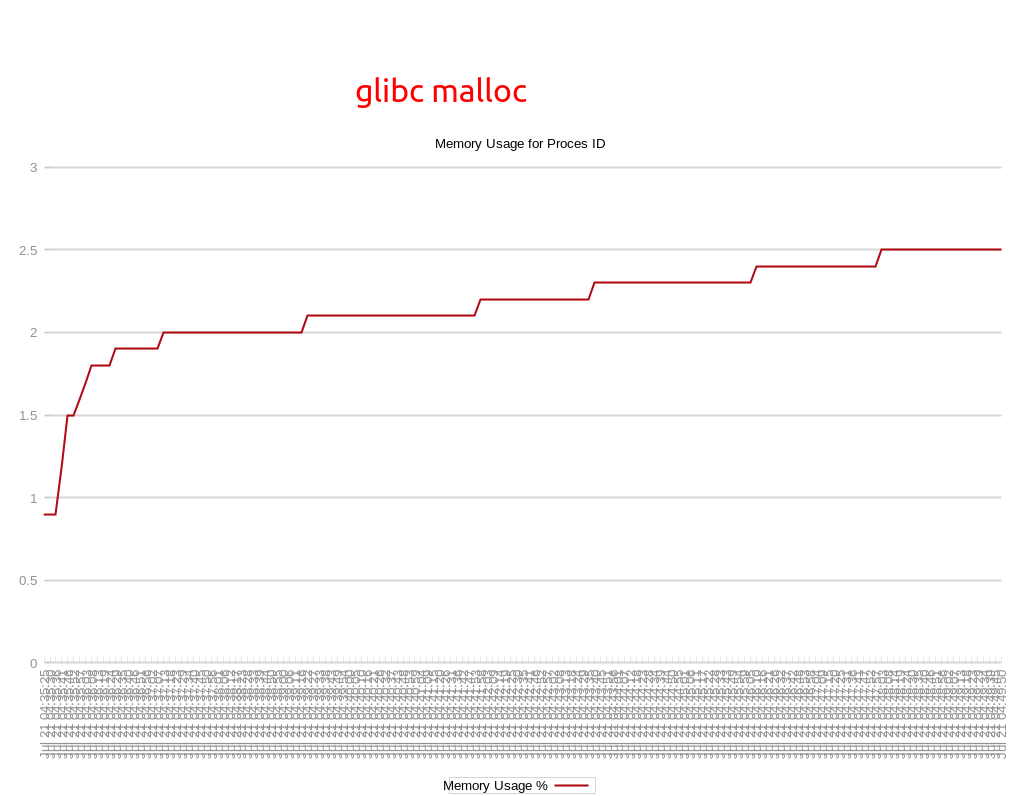
While this finding doesn't necessarily mean our memory usage will go up forever. It's still possible that the Rails memory usage will level off eventually, but we didn't find an such plateau over several runs of this long test.
We next decided to try the same test, but using jemalloc instead of glibc using the LD_PRELOAD environment variable approach above.
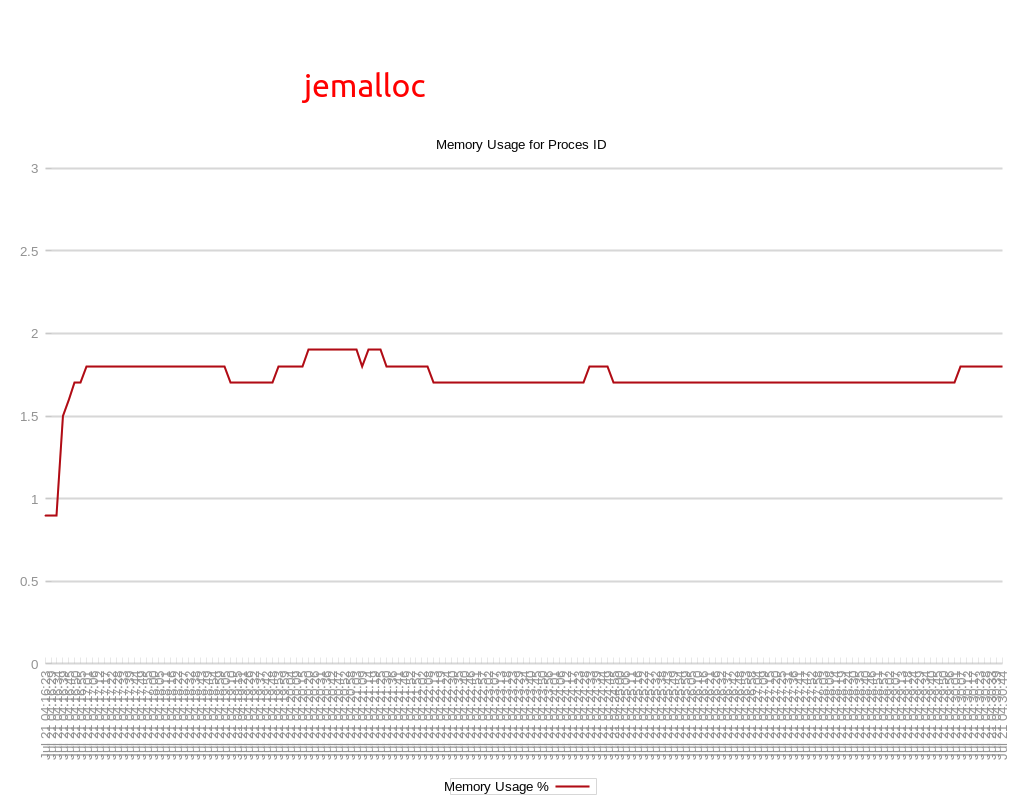
The memory behavior was very different with jemalloc! Instead of increasing throughout the test, with jemalloc memory usage increased quickly at the beginning of the test, but leveled off to a relatively stable point just below 2GB.
This result was very promising because it meant that:
- We could achieve a memory plateau (at least under some loads) with jemalloc
- That plateau was likely below any plateau that glibc may or may not have
Promising results in development don't necessarily translate to production though, so deploying the change in a more realistic environment was our next stage.
Testing jemalloc in production
We build our own Docker images to deploy Rails on Kubernetes to give us a lot of control over how Ruby is invoked when we run it in production. Just by adding the next two lines to our Dockerfile, we were able to install and use jemalloc in Rails when we deployed without any further configuration! We were very pleased and excited about how easy this change was to implement.
RUN apt-get install -y libjemalloc2
ENV LD_PRELOAD=/usr/lib/x86_64-linux-gnu/libjemalloc.so.2
Before we deployed to production, we were very careful to run our automated tests against our pre-production environments with jemalloc enabled, have our QA team keep a close eye out for problems, and have our engineering team watch for any new notification from our error-tracking service during this testing.
We also watched to see memory usage, but while usage was lower there, the load on our pre-production environment is also much lower than our production environment. Thus other than validating that there was not a spike in memory usage, we didn't take any conclusions from these observations.
Fortunately, no regressions showed up so we proceeded to deploy this change and kept an eye on the same charts we used when diagnosing the problem.
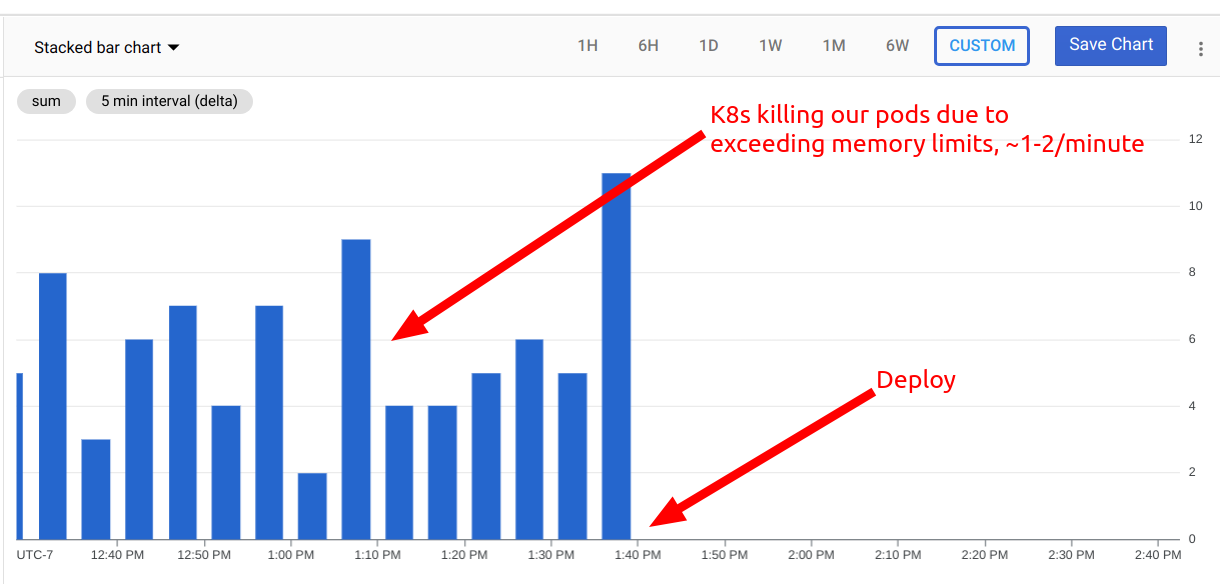
We carefully watched the memory charts (as well as monitored our error reporting and customer service tickets to be ready to revert if we found bugs) and the difference was very clear to see... Almost immediately, the number of Kubernetes pods (which run our Rails server processes) being terminated by Kubernetes dropped from 1 per minute to 0 for the next hour!
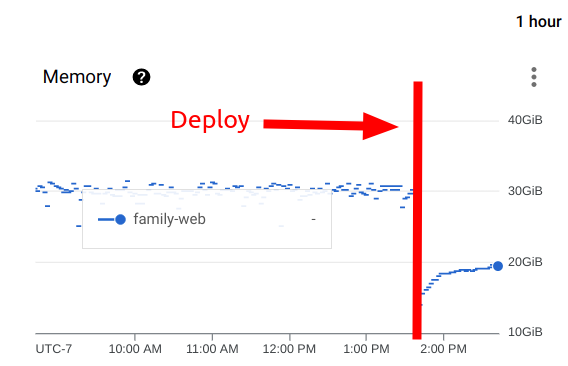
We also checked the aggregate usage of memory throughout our entire cluster and discovered that before the deploy, we were using 30GB (our limit), we were now using less than 20GB - less than 2/3rds of what we had been using before!
Wrapping up
Monitoring these same graphs now for several weeks, the improvement has stayed steady, given us better stability in our service, and reduced the amount of noise in our logging infrastructure.
We're very pleased with how everything turned out and how easy implementing the change was. We're also fairly confident in the change because of the roll out process we followed.
As a recap, that process was:
- Measuring our system's memory usage and process termination behavior to get a baseline
- Make hypotheses and explore solutions
- Implement those solutions, making sure not to introduce regressions, having an easy way to reverse the changes if we discovered any issues
- Check for changes in the baseline we saw before
- Repeat steps 2-4 until we're happy with the resolution
We hope our experiences will help you find and resolve any similar memory issues you might be facing!

